
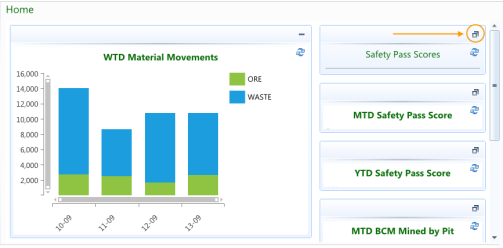
The dashboard page is designed to allow multiple views of data to be displayed for analysis on a single page. Dashboards can contain Charts or Data Grids. By default the charts and data grids will be shown at a medium size.
The Safety Pass Scores data grid in the above dashboard page displays the Safety Pass Scores by Department for each shift.
The MTD Material Movements (bcm) chart in the above dashboard uses line series to display the Actual, Budget and Forecast volumes of material moved within the current month.
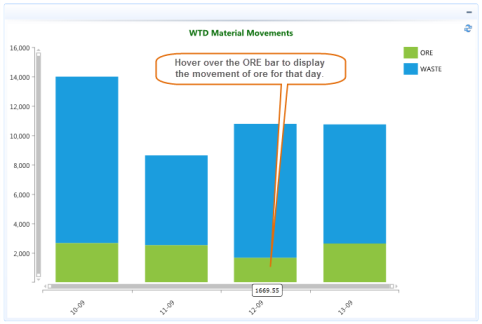
The WTD Material Movements chart in the above dashboard uses stacked bars to display the volumes of material moved within the current week.
The MTD BCM Mined by Pit chart in the above dashboard uses a pie chart to display the volumes of material moved for each Pit within the current month.
To view a chart or data grid in a large size click on the Maximise button on the top right hand corner of the chart or data grid.

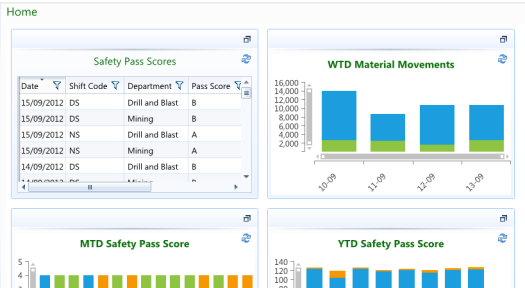
This will enlarge the chart or data grid in the centre of the page and show the other charts and data grids in a list on the right hand side of the interface or below.

In the example above he WTD Material Movements chart has been enlarged and the other charts and data grids have been moved to the right hand side of the interface.
To change which chart or data grid is shown in the middle of the screen press the Maximise button on the chart or data grid you want to view.
This will enlarge the selected chart or data grid in the centre of the page and minimise the previously maximised chart or data grid, placing it to right hand side of the interface or below.
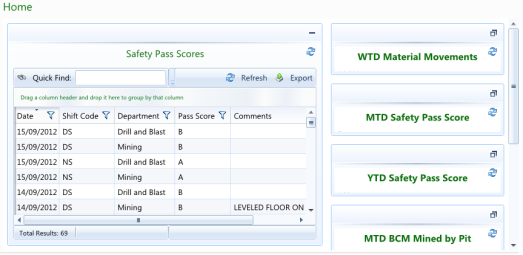
In the example above the Safety Pass Scores data grid has been enlarged and the WTD Material Movements chart has been minimised and placed to the right hand side of the interface with the other charts and data grids.
To return the screen to its original display, press the Minimise button on the chart or data grid shown in the middle of the screen.

This will minimise the chart or data grid across the page with the other charts and data grids.
Note: You can also maximise and minimise a chart or data grid by double clicking in the title bar. The minimised charts and data grids can be moved around the page by clicking in the title and drag and dropping.
The following table provides information on the buttons that appear on the dashboard chart and data grids.
| Buttons | Action/Name | Description |
|---|---|---|
|
|
Maximise |
Maximise the chart or data grid in the middle of the page. The other charts and data grids will be displayed in a list on the right hand side of the page or below. |
|
|
Minimise |
Return the chart or data grid to its original size. |
|
|
Refresh |
Will refresh the chart or data grid with existing filtering. |
|
|
Hide Filters |
The Filters panel will be collapsed. |
|
|
Show Filters |
The Filters panel will be expanded. |
|
|
Refresh Chart Filters |
Will refresh the chart applying any new filtering. |
Note: The Filters panel is only shown when the chart or data grid has been maximised. Refer to the Dashboard Filters for more information on dashboard filters.
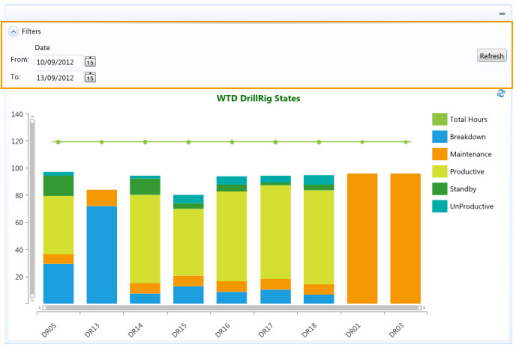
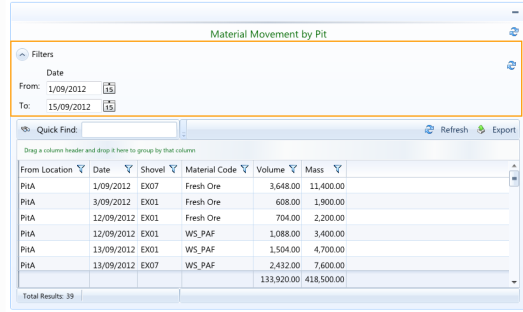
The Filters panel will be displayed when you maximise a chart or a data grid that contains filters, which have been defined in the query used to generate the chart or data grid.
In the examples below the Shift Date has been defined as a filter.
Charts may be resized so that you can zoom in on the data by:
Resizing or moving the scroll bars on the X-Axis and Y-Axis
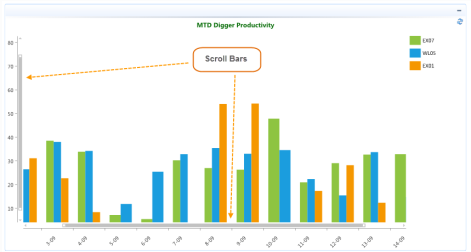
Moving the Mouse wheel forwards will zoom in on the data, whilst moving the mouse wheel backwards will zoom out.
Note: Both scroll bars will be adjusted as you move the mouse wheel.
Highlight a section of the chart by clicking and dragging the cursor to zoom in on the data within the selected rectangle/area.
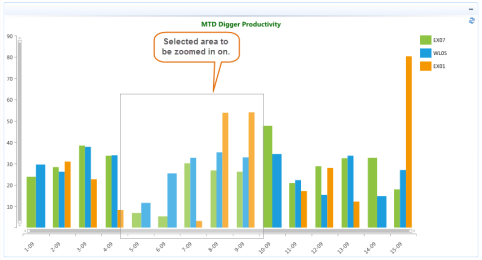
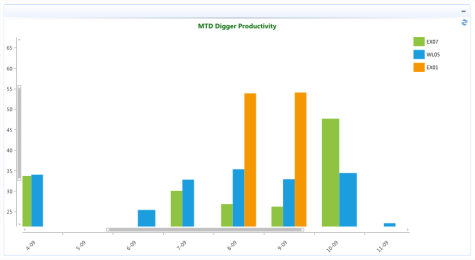
The chart will be re-sized / refreshed with the selected area.

It is possible to display the values behind the chart series by hovering over a legend entry or clicking on an individual series.
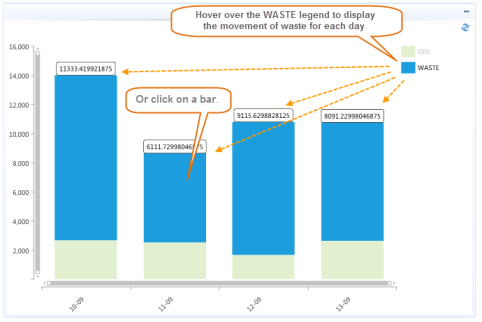
Hovering over an individual series will display the value for that series.
Refer to the Dashboards topic under the Administration Menu for information on creating Dashboard pages.


